
Columbus Day (or Indigenous Peoples' Day, as some might call it now) is kind of a sneaky holiday at Disney World. It's only one day, and not multiple days or an entire week, so most people think it won't be crowded. But this is often incorrect - Columbus Day usually spikes crowds leading to long lines and frustration among guests.
I haven't done a crowd report in a while, so I thought I would take a look at the crowds from last week, leading up to and beyond Columbus Day. I wanted to see what the crowd levels were like, how they compared to last year and what this might all mean for the coming, always busy holiday seasons. I found a few things that surprised me this year, so let's dig into the numbers.
As usual, all of these numbers and charts come from Thrill Data, which aggregates the wait times from the My Disney Experience app and releases them in an easy to digest format. This information is invaluable for posts like these. First, let's take a look at the week itself. I define "week" here as starting with Saturday 10/7 and running through Friday 10/13. I figured this would capture people looking to take advantage of the long weekend, and that it would likely show a spike over the weekend and Monday before returning to lower levels. Wait time numbers are listed across Walt Disney World in its entirety, not accounting for individual parks. This is a very macro view of wait times, but for our purposes as a whole, they should work to answer our questions. This is how it actually played out.
Saturday 10/7 - 37 minutes
Sunday 10/8 - 44 minutes
Monday 10/9 - 46 minutes
Tuesday 10/10 - 44 minutes
Wednesday 10/11 - 40 minutes
Thursday 10/12 - 35 minutes
Friday 10/13 - 44 minutes
Average wait time for the week - 41.4 minutes.
A couple of things stick out to me here. First, yes, the actual Columbus Day holiday had the highest wait times of the week, but not by a large margin. In fact, this "spike" can largely be explained by the recent weekday vs. weekend crowd dynamics we have discussed previously. In short, weekends have been less busy on the whole, with Monday being the busiest day of any given week. This is true here, holiday or not.
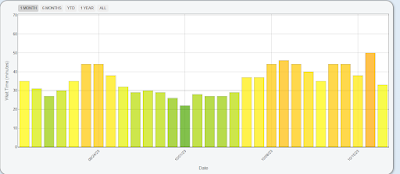
Second is that the trailing off of crowds that I expected to see as the week went on did happen ... kind of. I can't really explain that spike on Friday, except to say that crowds will now be elevated going forward and that the holiday didn't have a huge impact in this particular year. October used to be the "best" month to visit, and I think a lot of guests still have that in their minds and are surprised to find high crowds. Take a look at this graph below - the busiest day of the last month was actually Monday 10/16, a week AFTER Columbus Day, with an average wait time of 50 minutes.
One thought I had was that Mickey's Not So Scary Halloween Party had an impact on Magic Kingdom crowd levels as it often does. However, in this particular case, I don't think it matters much. For one, if we're looking at crowd levels across all parks, this should simply mean that the same amount of people are dispersed to the other parks on those nights, so the overall levels should be similar. And second, we're at the time of year where the Halloween parties are more prevalent - this past week alone, four out of the seven days of the week, that park closed early for the party. This is the same as last year, including the same days of the week.
Speaking of last year, I wanted to take a look at the crowd levels over the same period last year. In 2022, Columbus Day was on 10/10. Here's how that looked:
Saturday 10/8 - 48 minutes
Sunday 10/9 - 50 minutes
Monday 10/10 - 50 minutes
Tuesday 10/11 - 49 minutes
Wednesday 10/12 - 49 minutes
Thursday 10/13 - 47 minutes
Friday 10/14 - 49 minutes
Average wait time for the week - 48.9 minutes.
First, these numbers are incredibly similar for all seven days! This indicates to me that people who went for the holiday stayed all week, keeping crowds level across the board. So even last year, Columbus Day ITSELF didn't spike crowds, though the whole week was rather busy.
It also should be clear right away that by crowd level, last year was busier than this year. This continues a trend that has been many months in the making, with demand slowing across the board for Disney World, and the company releasing discounts and specials to entice people to return. This is not a surprise, but another example of seeing these kinds of amorphous ideas play out in real time and real numbers. If you had gone this same week this year and last year, you would have saved an average of 7.5 minutes per ride! That adds up over the course of a trip.
The wait time graph for last October as a whole is interesting however:

This year showed an uptick right after the holiday, where last year's numbers were very flat through this period, before dipping down again at the end of the month. Is this indicative of what is to come this year? I don't know for sure, and the higher crowds this week are throwing me off a little, but I would say this pattern is likely to continue. The end of October through mid-November is often a nice "sweet spot" to visit the parks even now, before crowds start increasing for Thanksgiving and into the Christmas season.
I originally wanted to post this to point to Columbus Day as that "sneaky" holiday mentioned above. But the most notable piece of information that came out of the data is that crowds continue to be lower year over year. Disney is often slow to react to these things, and in some cases, there simply isn't much they can do (with greater world effects such as inflation trumping anything the parks can offer). But it will be interesting to see how long this lasts, as well as whether Disney will continue to offer more substantial discounts to combat this into 2024.


No comments:
Post a Comment